100%Drift saturation

Production Pressure Overrides Maintenance

The "Run-to-Failure" debate begins. Since an asset is the primary throughput bottleneck, management is reluctant to shut down proactive maintenance without 100% certainty of the defect.

In operations, the drive to finish the shift often leads to catastrophic failure.

Early Signs & Initial Response

From raw signals to governed, actionable forecasts

The goal is to identify failures in the Warning Phase (2-17% drift) to allow for replacement planning.

  1. Stage 01Signal inventory and governance
    Predictive analytics diagram for stage 1 signal inventory and governance
    Stage 01: Signal inventory and governance
  2. Stage 02Data readiness and feature lineage
    Predictive analytics diagram for stage 2 data readiness and feature lineage
    Stage 02: Data readiness and feature lineage
  3. Stage 03Model development and validation
    Predictive analytics diagram for stage 3 model development and validation
    Stage 03: Model development and validation
  4. Stage 04Deployment and operational monitoring
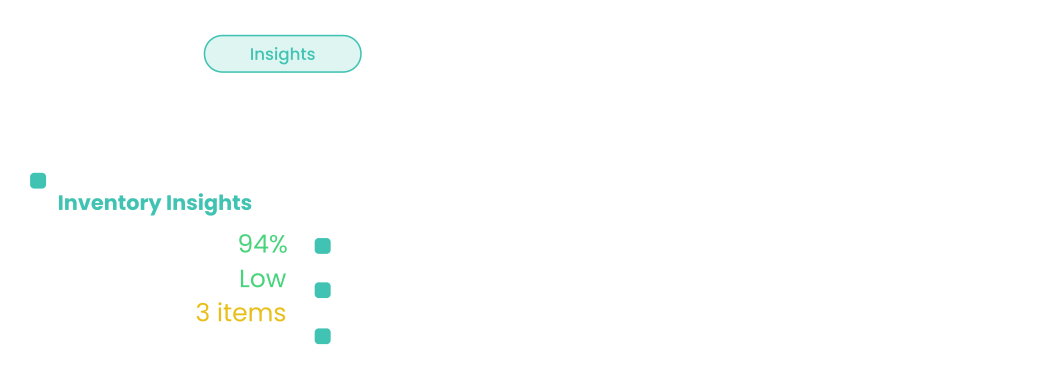
    Predictive analytics diagram for stage 4 deployment and operational monitoring
    Stage 04: Deployment and operational monitoring
  5. Stage 05Decision thresholds and workflow fit
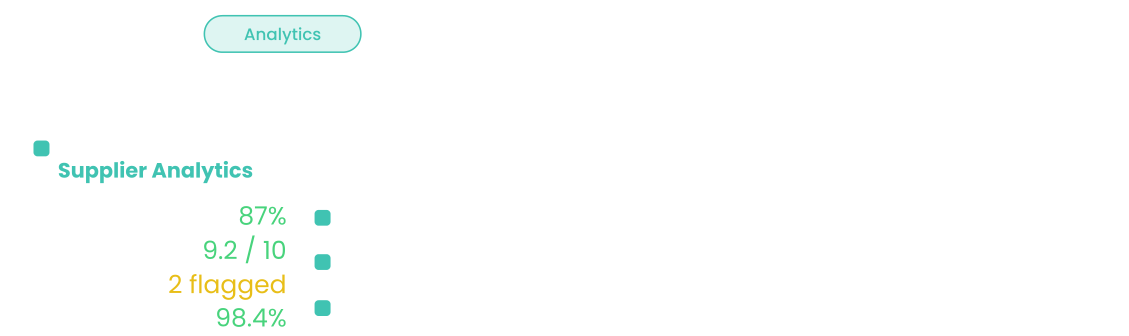
    Predictive analytics diagram for stage 5 decision thresholds and workflow fit
    Stage 05: Decision thresholds and workflow fit
  6. Stage 06Value tracking and model lifecycle
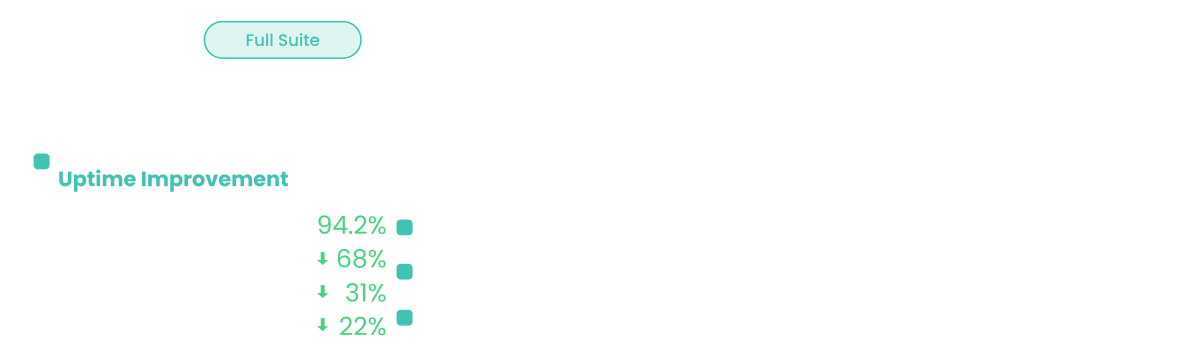
    Predictive analytics diagram for stage 6 value tracking and model lifecycle
    Stage 06: Value tracking and model lifecycle
In practice

Catch the failure in the warning phase.

An illustrative drift sequence: vibration drift crosses the 2% warning threshold on day 7; leaving a planning window instead of an unplanned stop.

Asset drift monitorIllustrative demo data — not live site metrics.
Vibration drift5.8%was 0.2% at baseline
DetectedDay 7drift crossed the 2% band
ReplacementDay 12planned inside the window
Drift vs failure threshold, by day
Warning phase · 2–17% driftFailure threshold 17%Detected — day 7
  • Drive-end vibration — trending above baseline
  • Asset health — degrading, modelled
  • Work order — raised for the planning window
  • Spares — reserved against the asset
Beyond yesterday's data

Operational foresight, not rear-view reporting

We combine live telemetry, history, and failure context so teams see drift before trips, downtime, or scrap hit the scorecard; moving from “what was the last reading?” to “how much runway do we have?”.

Deliverables stay in the forums you already run: trend and health, time-to-risk band, recommended actions, and traceable evidence the owner can stand behind in planning and maintenance.
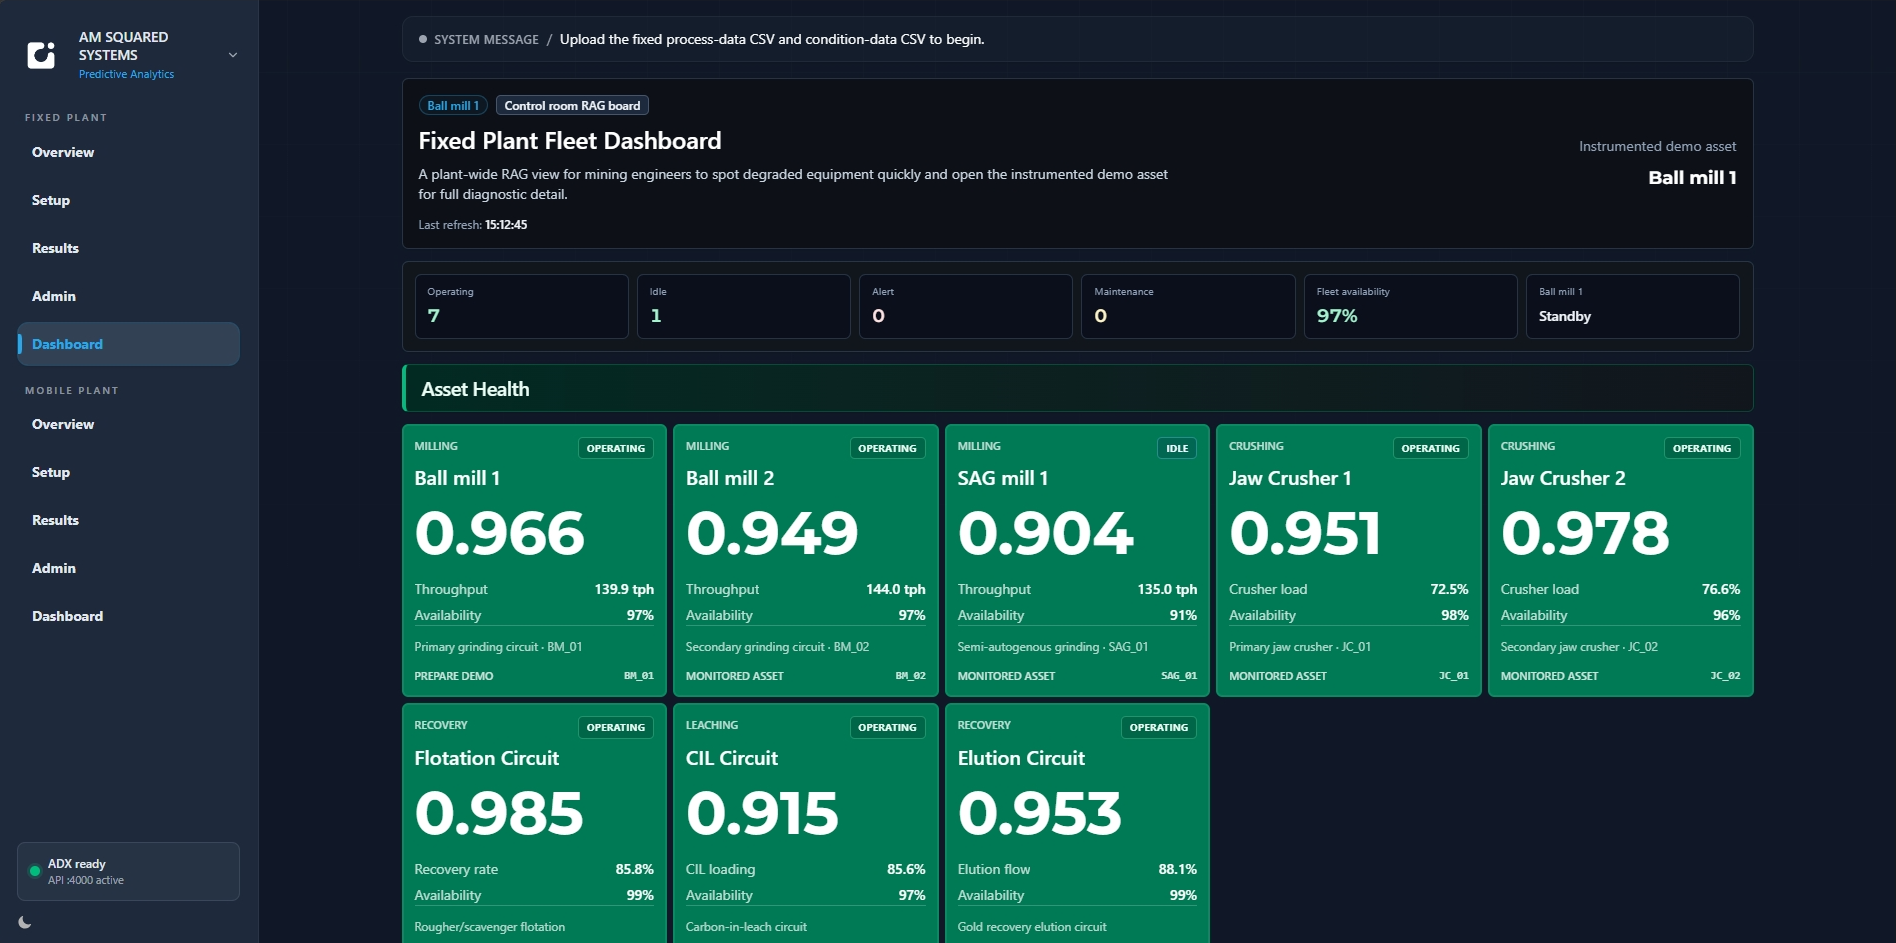
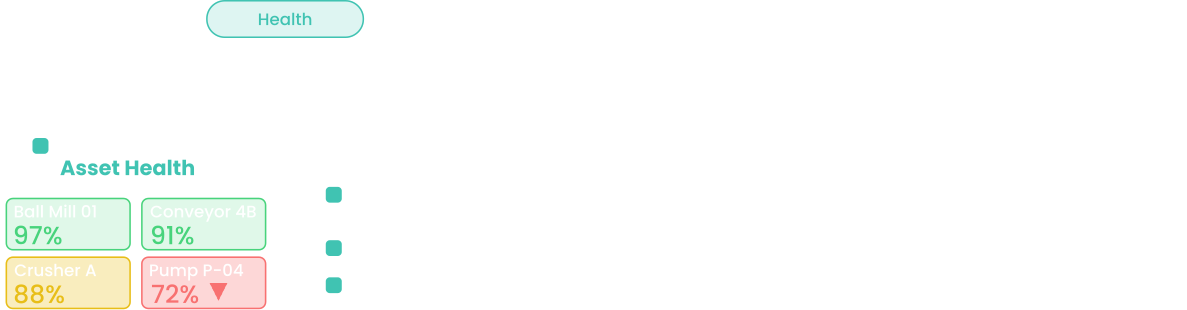
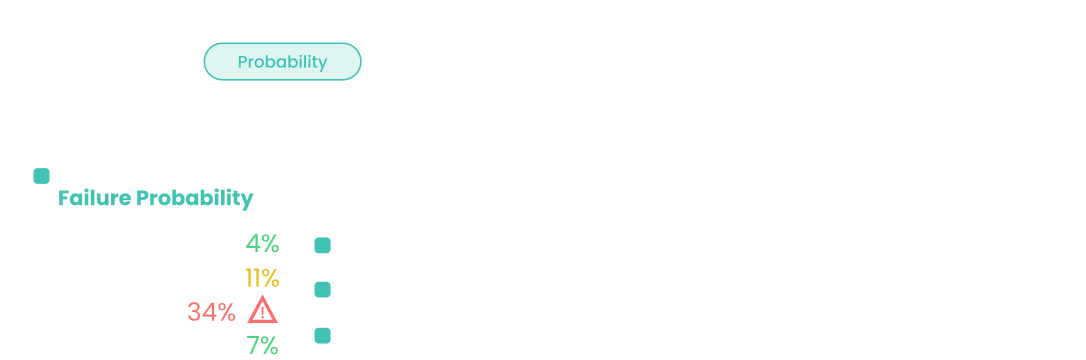
Predictive analytics dashboard: live measurements, asset health, failure probability trend, and drive-end vibration and temperature charts.
Next step

Talk through your signals before another proof-of-concept deck

Discovery maps data readiness, stakeholder questions, and the first governed outputs worth piloting—so effort lines up with how your site actually decides.